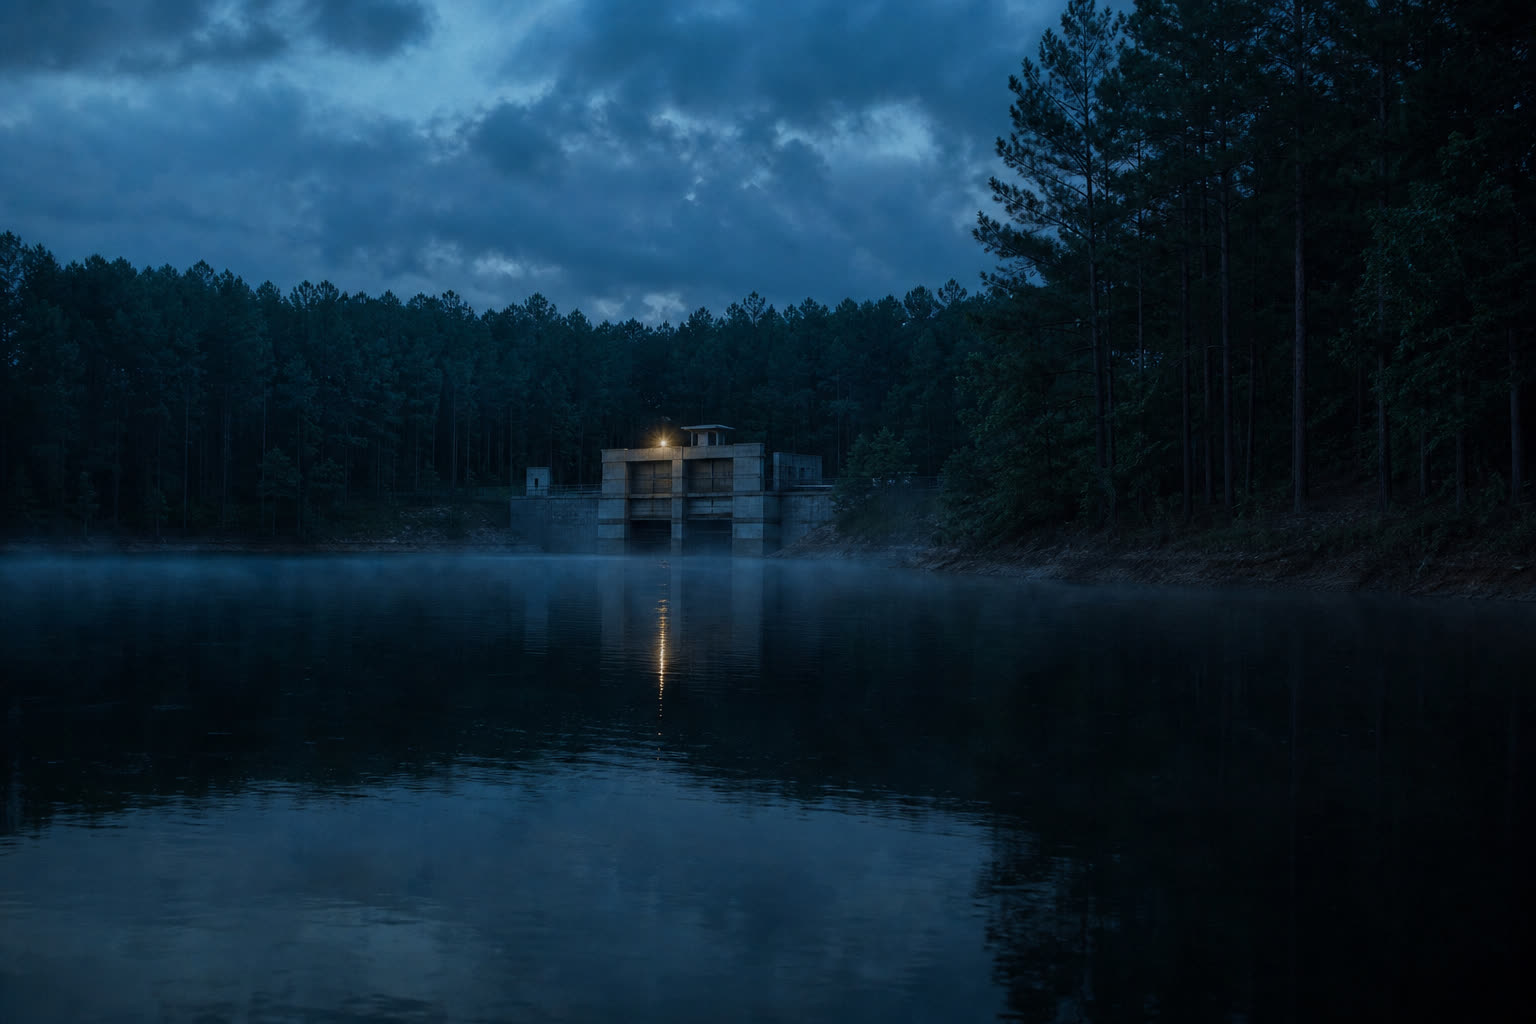
Skip to reportLake Murray. The Town of Lexington buys treated surface water from West Columbia’s plant on this reservoir.
Lexington, South Carolina · Town 2025 CCR + EWG · August 2026
What’s in Lexington tap water
The Town’s tap meets EPA legal limits and fails a stack of EWG health guidelines. Both of those facts are true.
01
Two utilities, two pipes
Lexington is not one tap. EWG lists both systems under the town name. This report leads with the Town utility. It does not average the two.
This report leads here
Town of Lexington
SC3210001 · EWG name “Lexington”
Serves (EWG)
21,500
Source
Purchased surface water
EWG years
2014–2024
SDWIS (newer)
~24,284
The Town buys treated Lake Murray water from the City of West Columbia plant on Old Cherokee Road. Official year on the latest Town CCR is 2025. EPA’s April–June 2024 quarter: in compliance with federal health-based drinking water standards.
Larger. Different pipes. EWG also files it under Lexington. Highlighted EWG exceedances: HAA5 16.3 ppb (163×), TTHMs 20.1 ppb (134×), PFOS 5.77 ppt, PFOA 2.80 ppt, hexavalent chromium 0.151 ppb. Chlorate 306.3 ppb vs guideline 210 sits in EWG’s “other detected,” not the exceedance grid. Not mixed into Town figures below.
EWG uses California OEHHA public-health goals and one-in-a-million cancer-risk levels. EPA maximum contaminant levels are older legal limits. A passing federal grade is not a clean bill.
EPA / DHEC
In compliance
For the quarter EPA assessed — April 2024 through June 2024 — Town tap was in compliance with federal health-based drinking water standards. The Town’s 2025 Consumer Confidence Report prints no violation on its tables and says the water meets or exceeds SCDES and EPA. West Columbia’s 2024 CCR says the same of SCDHEC and EPA.
EWG health guidelines
13 exceedances
On 2014–2024 tests reported to EWG by SCDHEC, 21 contaminants were detected in Town water. Thirteen sit above EWG’s health guidelines. Legal limits for several of these have not been updated in almost 20 years. Hexavalent chromium and chlorate have no federal MCL at all.
HAA5 and TTHMs sit far below EPA MCLs (60 and 80 ppb) and far above EWG guidelines (0.1 and 0.15 ppb). Chlorine kills microbes and makes these chemicals.
03
What is actually in Town water
EWG averages for Lexington SC3210001, 2014–2024. Multi-year, not a single-day sample, not Joint Municipal. Town 2025 CCR highest for HAA5 and TTHM is 24 ppb each — still under the MCLs, still far above EWG.
Disinfection byproducts
Formed when chlorine or other disinfectants treat the water. The group numbers and the individual species are both on EWG’s list.
Contaminant
Town avg
EPA legal
EWG guideline
× guideline
EWG notes
Haloacetic acids (HAA5)
11.7 ppb
60 ppb
0.1 ppb
117×
cancer
Haloacetic acids (HAA9)
15.1 ppb
—
0.06 ppb
252×
cancer
Total trihalomethanes (TTHMs)
18.9 ppb
80 ppb
0.15 ppb
126×
cancer
Chloroform
14.0 ppb
—
0.4 ppb
35×
cancer
Bromodichloromethane
4.65 ppb
—
0.06 ppb
77×
cancer
Dichloroacetic acid
7.08 ppb
—
0.2 ppb
35×
cancer
Trichloroacetic acid
4.29 ppb
—
0.1 ppb
43×
cancer
Dibromoacetic acid
0.195 ppb
—
0.03 ppb
6.5×
—
Dibromochloromethane
0.263 ppb
—
0.1 ppb
2.6×
cancer
HAA5: EWG 0.1 · Town EWG avg 11.7 · EPA 60
0.111.760
TTHM: EWG 0.15 · Town EWG avg 18.9 · EPA 80
0.1518.980
PFAS
EWG still prints PFOS and PFOA legal limits as proposed. EPA finalized 4.0 ppt MCLs in April 2024; compliance is 2029. Town CCR UCMR5 averages match EWG: PFOS 5.475 ppt, PFOA 3.275 ppt, HFPO-DA 7.15 ppt. HFPO-DA is under both the 10 ppt MCL and EWG’s 9 ppt guideline — not one of the 13 exceedances.
Contaminant
Town avg
EPA MCL
EWG guideline
× guideline
EWG notes
PFOS
5.48 ppt
4 ppt
0.3 ppt
18×
—
PFOA
3.28 ppt
4 ppt
0.09 ppt
36×
cancer
HFPO-DA (GenX)
7.15 ppt
10 ppt
9 ppt
under
detected, not an exceedance
PFHxA
4.1 ppt
—
1000 ppt
under
detected
PFPeA
4.28 ppt
—
1000 ppt
under
detected
Chlorate and hexavalent chromium
Neither has a federal MCL. Chlorate, 520.8 ppb, is 2.5× EWG’s 210 ppb UCMR benchmark (EWG also notes the national average at 116.8 ppb). Hexavalent chromium, 0.178 ppb, is 8.9× California’s 0.02 ppb public-health goal, which EWG uses.
Thirteen times-above-guideline
Bar length is log-scaled so HAA9 at 252× does not flatten the rest. The number on each bar is the EWG multiplier.
Also detected, under EWG guideline
1,4-Dioxane 0.0754 ppb (guideline 0.35)
Manganese 8.57 ppb (guideline 100)
Monochloroacetic acid 0.0992 ppb (guideline 53)
Strontium 0.0511 ppb (guideline 1500)
Vanadium 0.589 ppb (guideline 21)
04
Official Town CCR — 2025
Latest printed year is calendar 2025 (Jan 1–Dec 31). Purchased surface water from the City of West Columbia, Lake Murray WTP, Old Cherokee Road, 22.5 MGD. PWSID SC3210001. Town claim: meets or exceeds SCDES and EPA. No violations in the printed tables.
Year
Analyte
Highest / 90th
Range
MCL / AL / MRDL
Violation
2025
Haloacetic acids (HAA5)
24 ppb
18.06–42.71
60 ppb
No
2025
Total trihalomethanes (TTHM)
24 ppb
0–30.156
80 ppb
No
2025
Chlorine
0.10 ppm
0.10–0.10
MRDL 4 ppm
No
2025
Lead
90th 4 ppb · 1 site over AL
0–28 ppb
AL 15 ppb
No
2025
Copper
90th 0.082 ppm · 0 sites over AL
0.013–0.063 ppm
AL 1.3 ppm
No
2025
Coliform
1 positive monthly sample
fecal / E. coli 0
MCL 1 positive / month
No
2024
Haloacetic acids (HAA5)
15.0 ppb
1.022–36.88
60 ppb
No
2024
Total trihalomethanes (TTHM)
19.0 ppb
12.73–23.26
80 ppb
No
2023
Haloacetic acids (HAA5)
18.0 ppb
0–34.14
60 ppb
No
2023
Total trihalomethanes (TTHM)
19.0 ppb
13.40–24.61
80 ppb
No
Printed as-is: the 2025 lead range is written “0–28 ppm” with units ppb — same unit mixup as 2023 and 2024. Treated here as 0–28 ppb (one site over AL 15 is consistent with a 28 ppb max and a 90th of 4). Copper 90th is printed 0.082 ppm, higher than the printed range max 0.063. Internally inconsistent; reported as printed.
This is the plant the Town buys from. 22.5 MGD. Source: Lake Murray. Riverside on the Saluda is a different plant and a different finished-water stream. City claim: the water meets and exceeds SCDHEC and EPA standards. PFAS is not in this CCR.
Finished-water numbers
Fluoride
0.450 ppm (0.110–0.800)
Nitrate
0.020 ppm
HAA5 LRAA
25.03 ppb (0.00–62.07)
TTHM LRAA
23.12 ppb (13.54–66.92)
Chloramines
3.20 ppm (2.72–3.58)
Turbidity
0.23 NTU
Sodium
18 ppm
TOC removal
43.91%
An individual HAA5 result of 62.07 ppb is above the 60 ppb MCL. Compliance is the locational running annual average — 25.03 — and the CCR prints no violation.
Lead and copper (2022)
Lead 90th
0.26 ppb range 0–14 · 2022
Copper 90th
0.096 ppm 2022
Lead and copper are at-the-tap. Town 2025 lead 90th is 4 ppb with one site over the action level. West Columbia’s 2022 plant-system 90th is 0.26 ppb. Different pipes, different year. Not averaged.
EWG’s West Columbia page (SC3210004, 2013–2023) still lists PFOS 1.20 ppt and PFOA 0.780 ppt. Those are long-term averages, not “what is in the water now.” Aggregators citing UCMR5 report West Columbia maxima of PFOS 7.9 ppt and PFOA 6.1 ppt — ZIP-level / wholesale samples, not the Town’s number. Prefer the Town CCR UCMR5 table for SC3210001.
Primary source: the UCMR5 block printed in the Town’s 2025 CCR. Those rows are 2024 data, same table as the 2024 CCR. Maxima sit above the 2029 4 ppt MCL for PFOS and PFOA. Not a current violation. Compliance is 2029.
Analyte
Avg
Max
Min
PFOS
5.475 ppt
5.7 ppt
5.3 ppt
PFOA
3.275 ppt
4.4 ppt
0
HFPO-DA
7.15 ppt
9.1 ppt
6.4 ppt
PFPeA
4.275 ppt
4.5 ppt
4.0 ppt
PFHxA
4.1 ppt
4.3 ppt
3.8 ppt
EWG’s Town averages (PFOS 5.48, PFOA 3.28, HFPO-DA 7.15) match this table. HFPO-DA max 9.1 ppt is under the 10 ppt MCL. Do not swap in West Columbia’s EWG 1.20 ppt PFOS, and do not use ZIP-level aggregator maxima (PFOS 7.9, PFOA 6.1) as the Town’s number.
mytapwater.org, citing EPA UCMR5, dates a Town PFOS max of 5.7 ppt to 2024-04-15 and a PFOA max of 4.4 ppt to 2024-01-22. Secondary to the CCR table.
EWG’s filter guide for this utility, not a product pitch. No brand.
Activated carbon
11 of the guideline exceedances
+4 other detected contaminants. EWG: can reduce levels of many common contaminants. Lower upfront cost, reduced maintenance. Does not remove all contaminants.
Reverse osmosis
12 of the guideline exceedances
+6 other detected contaminants. EWG: most effective. Higher upfront cost, more maintenance, wastes water.
EWG also lists ion exchange (softens hard water; does not remove all contaminants) and whole-house filters (useful for radiologicals and TCE; expensive, with a bacterial-contamination risk). Filtering options EWG tags on the disinfection-byproduct pages for this utility are activated carbon and reverse osmosis.
EWG wording on legal vs. safe, disinfection byproducts, and filter counts (carbon 11 / RO 12) from the SC3210001 utility page.
Figures from the Town CCRs, EWG pages, and findings.md / data.json. Gaps labeled, not invented: 2025 copper 90th vs range; 2025 lead ppm/ppb print error; JMWSC official CCR PDF not obtained; West Columbia 2025 CCR not posted; EPA UCMR5 occurrence zip not downloaded this session. Compiled August 2026.